TL;DR: Panama City Beach Water Temperature
-
Warmest water: July and August average around 85°F, making summer ideal for swimming without a wetsuit.
-
Best swimming season: June through September typically offers Gulf temperatures of 82°F or warmer.
-
Best shoulder months: May and October combine water in the mid-to-upper 70s°F with smaller crowds and better rental availability.
-
Coldest water: January and February can fall to around 58°F, making wetsuits advisable for swimming.
-
Check before swimming: Gulf temperatures can change quickly with weather and wind, so check NOAA NDBC Station PCBF1 for current conditions before heading to the beach.
The Gulf at Panama City Beach typically runs in the low-to-mid 80s°F (around 27–29°C) during peak summer, making it genuinely comfortable for swimming without a wetsuit. In winter, it drops to the low-to-mid 60s°F (around 17–18°C), where a thin wetsuit makes a real difference. For the most current reading, check NOAA NDBC Station PCBF1 (Station ID 8729210) or the PCBF1 real-time data feed directly. One quick note: all timestamps on the NDBC station page are in GMT, so subtract 5 hours for Central Standard Time (or 4 hours during daylight saving) before planning your beach day.
Key Takeaways
Panama City Beach Gulf water temperatures follow a reliable seasonal cycle, peaking around 85°F in July–August and dropping to roughly 58°F in January–February, with June through September offering the most comfortable swimming conditions.
| Point | Details |
|---|---|
| Peak swim months | June through September, with water at or above 82°F — no wetsuit needed. |
| Coldest months | January and February average around 58°F; a 3mm full wetsuit is recommended for swimming. |
| Live data source | Check NOAA NDBC Station PCBF1 for current readings; timestamps are in GMT. |
| Wetsuit threshold | Below 68°F, wear a full wetsuit; 68–75°F, a shorty or thermal top helps. |
| Panamacitybeachflorida | Lists beachfront rentals timed to warm-water windows, with shoulder-season availability at lower rates. |
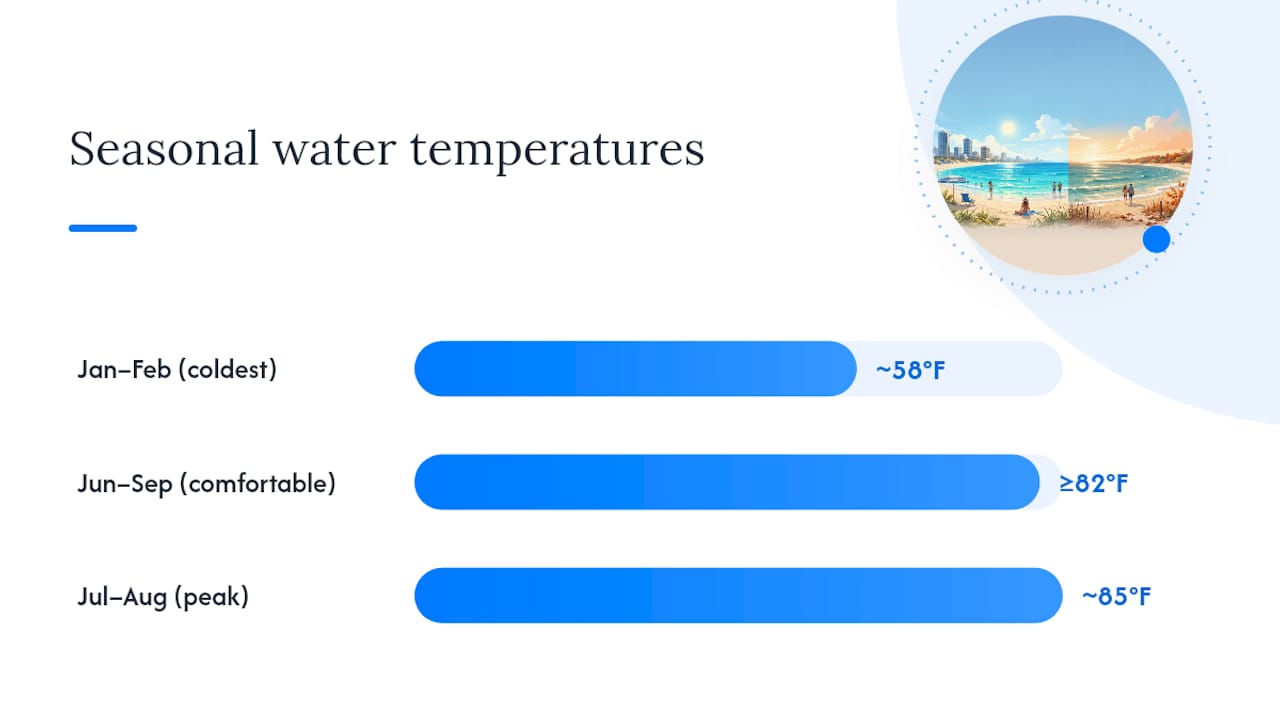
Table of Contents
What is the water temperature at Panama City Beach by month?
The table below draws from NCEI coastal climatology and NDBC station records. Each figure represents a typical monthly sea-surface temperature (SST) for recreational planning purposes, not a guaranteed daily reading.
These averages reflect typical Gulf SST measured at or near the surface. Nearshore water at waist depth can feel a degree or two warmer on a calm, sunny afternoon, and a few degrees cooler after a strong offshore wind.
When is the Gulf warmest and coolest for swimming?
Best months for warm-water swimming:
-
June through September — water stays at or above 82°F (28°C), well above any wetsuit threshold. July and August are the peak, with averages around 85°F (29°C).
-
May and October — shoulder months with water in the mid-to-upper 70s°F. Comfortable for most swimmers, and local guides consistently flag these windows as ideal for warm water with smaller crowds and better rental rates.
Cooler months and what to expect:
-
November through March — temperatures fall from the upper 60s°F down to the high 50s°F. January and February are the coldest, typically sitting around 58°F (14°C). That is cold enough to limit comfortable swimming to short dips, even for experienced open-water swimmers.
-
April — water climbs back toward 69°F (21°C). Manageable with a spring suit, and the beach is far less crowded than summer.
According to beach-condition reports for Panama City Beach, the annual range runs roughly 65–87°F (18–31°C), with the warmest water arriving in late July and the coldest in early February. Cold fronts pushing down from the north can temporarily drop nearshore temperatures by several degrees, even in spring, so checking live data the day before you plan to swim is always worth it.
Do you need a wetsuit at Panama City Beach?
Short answer: not in summer, but the shoulder and winter months are a different story. Here are the practical thresholds:
-
Above 82°F (28°C): No wetsuit needed. A swimsuit is all you want. This covers June through September.
-
75–82°F (24–28°C): Comfortable for most adults in a swimsuit. Sensitive swimmers or kids may appreciate a short-sleeve spring suit. Covers May and October.
-
68–75°F (20–24°C): A 2mm shorty or thermal rash guard makes a noticeable difference, especially for longer sessions. Covers April and November.
-
Below 68°F (20°C): A 3mm full wetsuit is the right call. December through March falls here.
Wind chill and air temperature matter as much as the SST reading. A 72°F water temperature feels colder on a breezy 55°F morning than on a calm 80°F afternoon. Rip currents are also a year-round concern at Panama City Beach, so always swim near a lifeguard station regardless of water temperature.
Pro Tip: A sudden 3–4°F drop in the SST reading often means an offshore wind has pushed warm surface water away and pulled cooler water up from depth. This is called upwelling, and it can happen overnight. Check the NDBC station the morning of your beach day, not the night before.
Historical highs, lows, and long-term trends
The NDBC climatic summary plots for Station PCBF1 display the long-term mean, standard deviation, and quartile ranges for sea temperature across the full station record. These plots are the clearest way to see how much variability exists around the monthly averages and whether a current reading is unusual.
For station provenance and access to older historical meteorological records, the NOAA Tides & Currents page for Station 8729210 links to the full station history. The NDBC station history page also points to longer archival records if you want to dig into multi-decade trends. What the climatic plots show, broadly, is that the Gulf here warms and cools on a predictable seasonal cycle with relatively low year-to-year variability, which makes the monthly averages a reliable planning tool.
How to check live Gulf water temperature right now
Getting a current reading from NOAA NDBC Station PCBF1 takes about 60 seconds:
-
Go to the NDBC Station PCBF1 page.
-
Look for the “Water Temperature” row in the current conditions table. The value is in degrees Celsius by default on some views; click the °F toggle or convert manually (°F = °C × 9/5 + 32).
-
Check the timestamp at the top of the table. It is in GMT. Subtract 5 hours for Central Standard Time or 4 hours during daylight saving time.
-
For a rolling 45-day history and trend plots, open the PCBF1 real-time data feed directly.
Alternative live sources and their trade-offs:
-
Seatemperature: User-friendly daily SST with a plain-language swim recommendation. Updates daily; slightly less granular than NDBC but easier to read at a glance.
-
NOAA PMEL/OSMC satellite SST maps: Regional Gulf SST from satellite. Useful for seeing broader temperature patterns but can differ from nearshore readings by a few degrees.
-
Surf-forecast sites: Many surf-forecast pages pull NDBC data and add swell and wind context, which is useful if you are planning water sports beyond swimming.
Pro Tip: Before heading out, check air temperature and wind speed alongside the SST. A 78°F water reading with a 20 mph north wind and 62°F air temperature is a very different experience from the same water temp on a calm, sunny day.
Why do different sources show different temperatures?
Three distinct measurement types feed the temperature numbers you see online, and they do not always agree.
In-situ station readings (like NDBC PCBF1, maintained by NOAA’s National Ocean Service at coordinates 30.213°N, 85.880°W) measure water temperature directly with a submerged sensor. These are the most accurate for the specific location and depth of the instrument, but they represent one point in the water, not the entire beach.
Satellite-derived SST measures the skin temperature of the ocean surface from orbit. It covers large areas but can be blocked by clouds and typically reflects offshore conditions rather than the shallow nearshore zone where you are actually swimming.
Nearshore and surf-zone temperatures are what you feel at waist depth. Shallow water heats and cools faster than deeper offshore water. On a sunny afternoon with light winds, the nearshore can run 2–4°F warmer than the NDBC station reading. After a night of strong offshore winds, it can run cooler.
NOAA/NDBC, NCEI, IOOS, and PMEL are the authoritative institutional sources for Gulf SST data. Public aggregators like Seatemperature.org pull from these feeds and reformat them for general audiences. When sources disagree, the NDBC station reading is the most locally specific and current.
What it actually feels like at the beach
From a traveler’s perspective, the data translates into something pretty clear. June through September, the Gulf at Panama City Beach feels like a warm bath by early afternoon. Morning swims are slightly cooler as the surface hasn’t had time to absorb the day’s heat, but rarely uncomfortable. October is a sweet spot: water still in the mid-70s°F, crowds thinning, and the air cooling to pleasant highs in the low 80s°F.
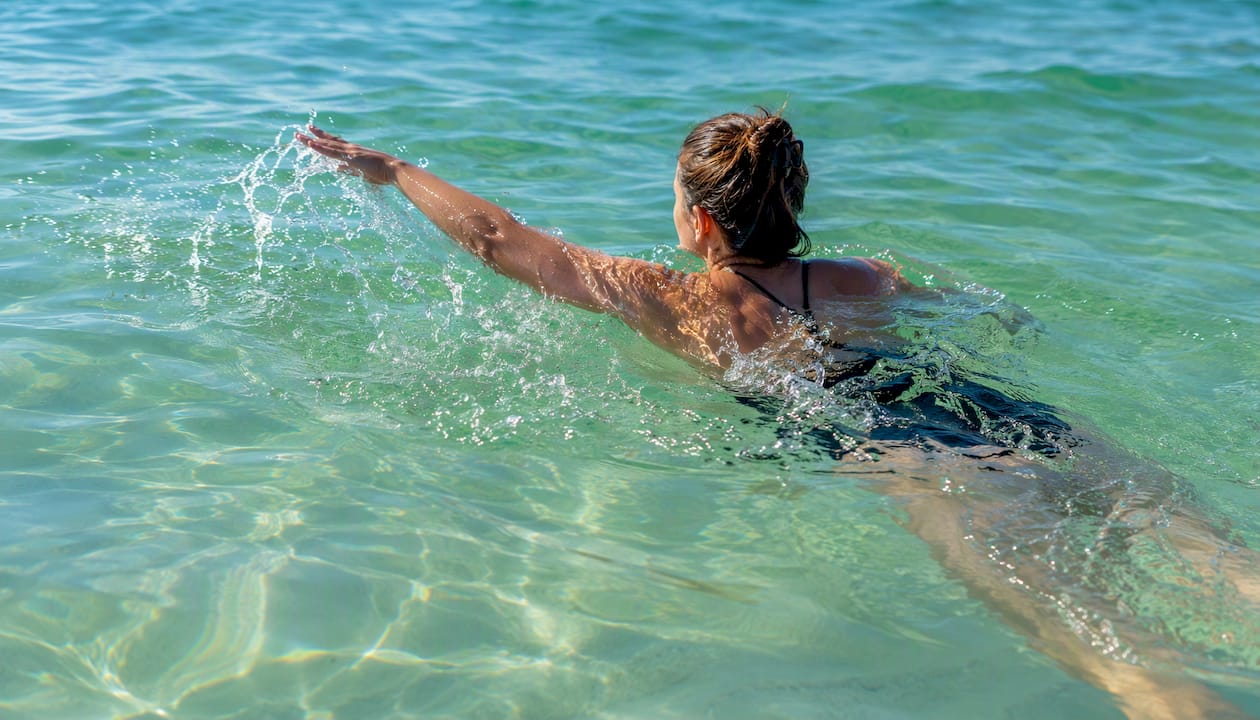
Winter visits are a different kind of trip. The water is cold enough that most people skip swimming entirely, but the beach itself is beautiful and uncrowded. Spring break in March catches the water still in the low 60s°F, which surprises some visitors expecting summer conditions.
Quick packing checklist by season:
-
June–September: Swimsuit, reef-safe sunscreen, water shoes for the sand, and a hat. No wetsuit needed.
-
May and October: Add a light rash guard or 2mm shorty if you plan extended time in the water.
-
April and November: Pack a 2–3mm spring suit if swimming is a priority. A light jacket for evenings.
-
December–March: 3mm full wetsuit if you intend to swim. Layers for the beach. Check live data before any water activity.
-
All seasons: Verify the current NDBC reading the morning of your beach day.
Time your trip to the water with the right rental
The warmest water windows, June through September, fill up fast on Panama City Beach. Shoulder months like May and October give you water temperatures in the comfortable 75–82°F range with noticeably lower demand and better availability. Browse beachfront vacation rentals on Panamacitybeachflorida to see what is open during your preferred swim window, whether that is a peak-summer week or a quieter fall getaway.
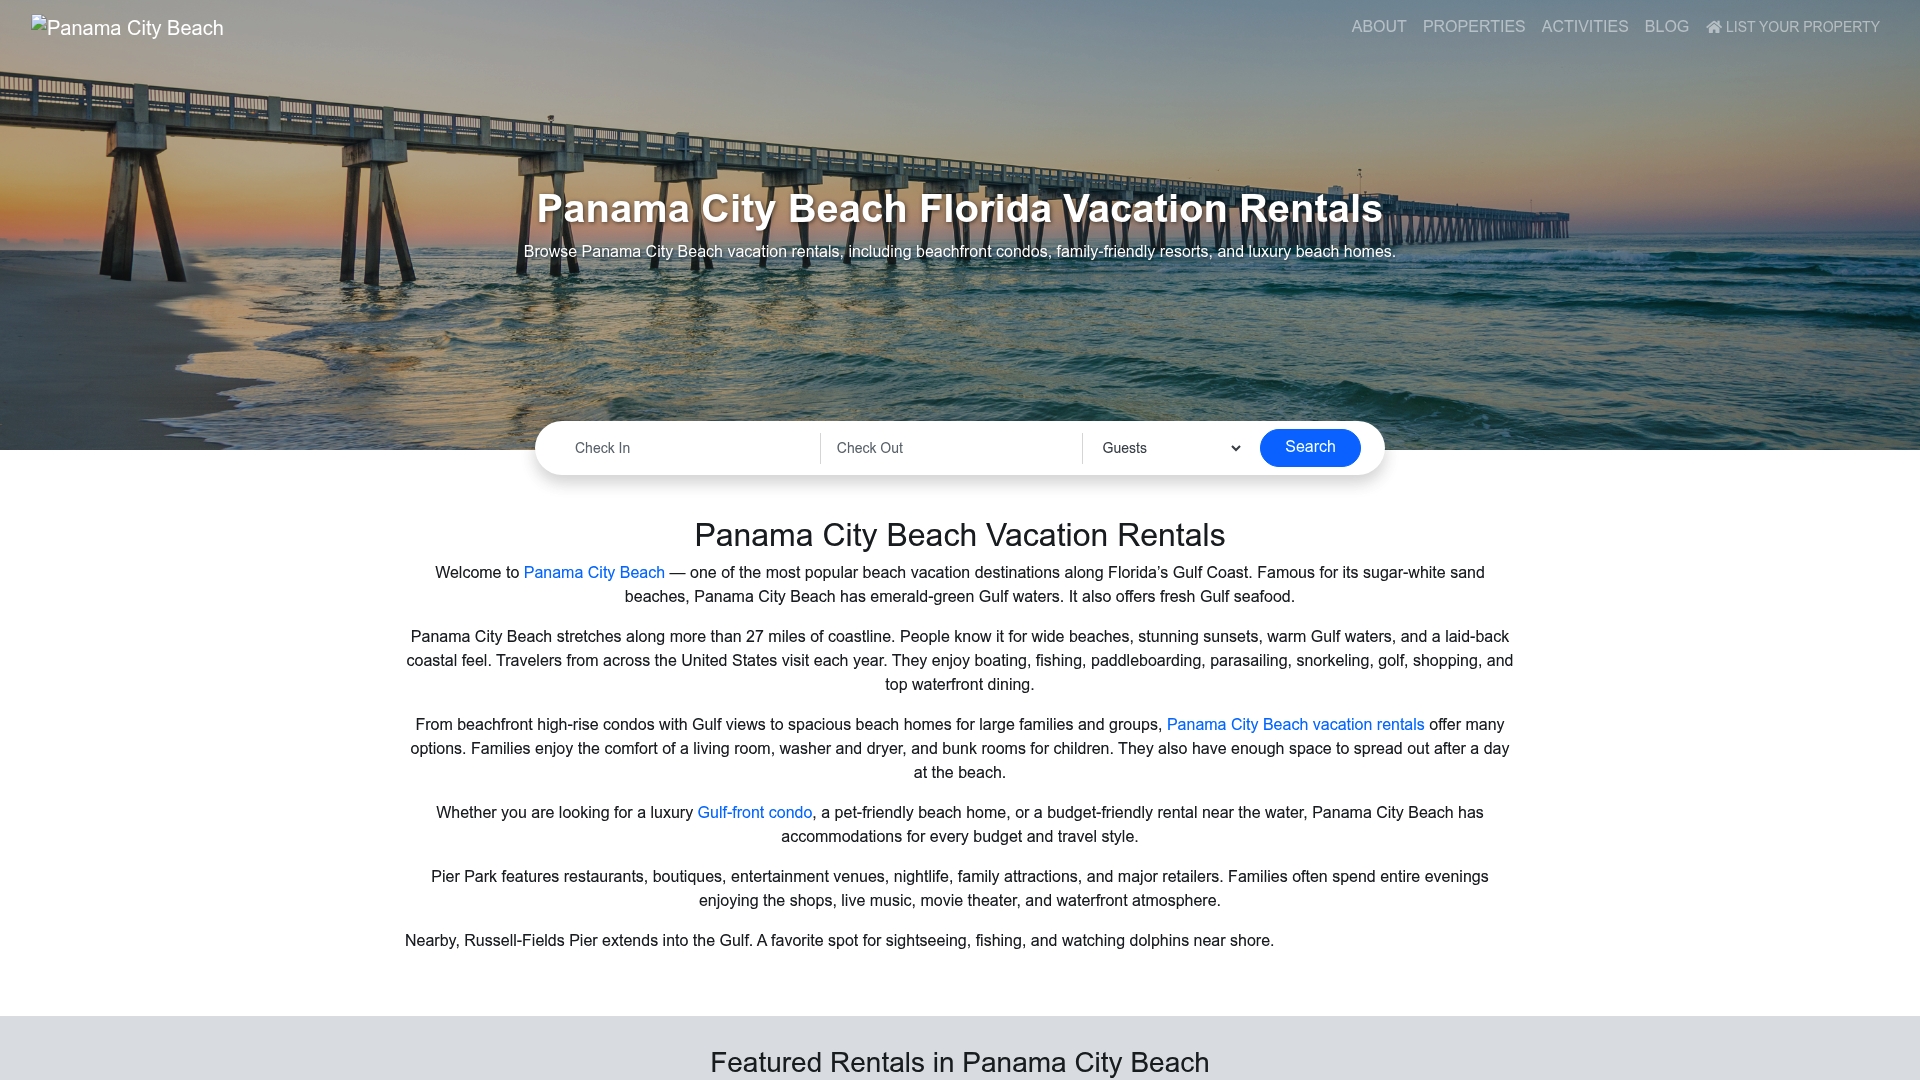
Panamacitybeachflorida lists beachfront condos, beach homes, and family-friendly properties directly on the Gulf, so you can walk out the door and into the water during those prime temperature windows. Popular weeks in July and August book months in advance. If your schedule is flexible, targeting late May or early October gets you warm water, open beach, and more options at lower rates. Check availability for your dates and lock in your stay before the best properties go.
Sources
Recommended
-
Panama City Beach Vacation Rentals | Beachfront Condos & Homes
-
Panama City Beach Vacation Rentals | Homes, Condos, Things To Do
About the Author
Joe Godar of the PanamaCityBeachFlorida.com Editorial Team creates destination guides, vacation-planning resources, and local travel content focused on Panama City Beach, Florida.
Our team researches local beaches, vacation rental trends, family activities, restaurants, attractions, events, and direct-booking best practices. Every guide is created to help travelers plan more confidently, experience the best of Panama City Beach, and avoid unnecessary third-party guest service fees.
PanamaCityBeachFlorida.com is part of the Emerald Coast by Owner marketing family, connecting travelers directly with verified vacation rental hosts throughout the Gulf Coast since 2016.
This article was reviewed for accuracy and updated using local destination research and current Panama City Beach vacation rental market insights.